

- Pfizer Inc. Stock (PFE) is currently trading at $36.89 with a minor decline of 0.05% in the last 24 hours.
- The Pfizer Inc. Stock 52-week range is 36.16 – 54.93.
- The (PFE) market capitalization is $216.215 Billion.
By analyzing the price data of the (PFE) stock, it is observed that it is in a downtrend. The price declined by -8.29% in the last seven days and we can say that Pfizer Inc. stock is performing poorly. It gave a negative return of -28.60% in the last 1 year. The current market views are not so good about the stock. No huge volume is present in it. As of now, there is no buyer interested in buying Pfizer Inc. stock. There is bearish dominance in the market.
Pfizer Inc. Stock (PFE) Technical Analysis
The price of Pfizer Inc. stock (PFE) has slipped below 50 and 200 EMA, which suggests that the price is in a bearish trend. If the sellers continue to push the price down, the stock’s value may fall even further in the upcoming week. The bears are not in the mood to give power to bulls right now. A death cross has been seen in the chart.
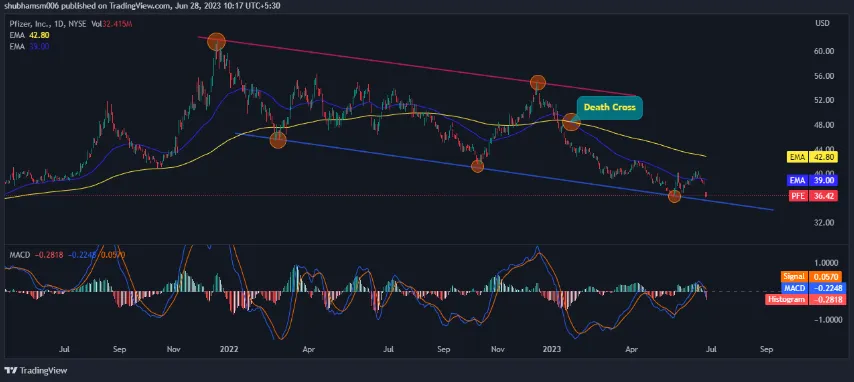
Source: (PFE)/US DOLLAR .1D by TradingView
The technical indicator MACD is also in negative territory. The MACD line at -0.2248 and signal line at -0.2818 is below the zero line, suggesting that the MACD is in negative territory and is giving bearish signals.
The current value of RSI is 34.12 points. The 14 SMA line is currently below the median line, around 51.57 points which shows bearish sentiment in the market. The bearish trend is indicated by the 14-day SMA line below the median line. As the price is in oversold territory, the market is experiencing bearish sentiment.
Pfizer Inc. Stock Trendline Analysis:
The price has respected its significant trendline resistance and is heading for support. As soon as the price breaks the trendline, it will go down to the next support.
Source: (PFE)/US DOLLAR .1D by TradingView
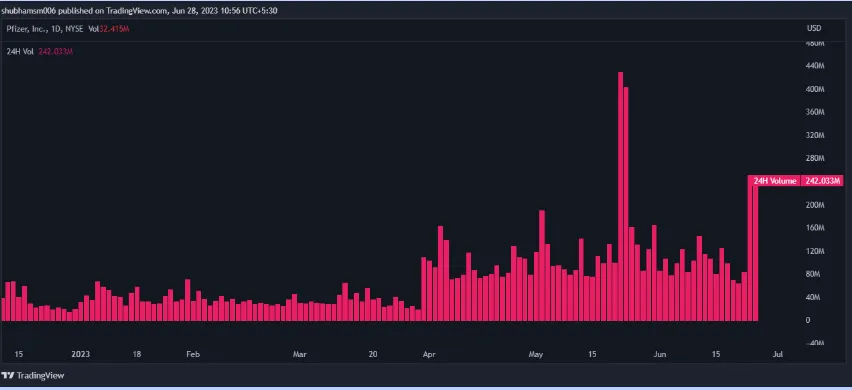
Volume Analysis:
Pfizer Inc. stock (PFE)’s average trading volume for the last three months is 25.67 Million and the average volume for the last 10 days is 30.37 Million.
Technical Levels:
- Support – The current support level of (PFE) is $35.9.
- Resistance –The current resistance level of (PFE) is $40.32.
Summary
Pfizer Inc. stock (PFE) is struggling in the market. The price action shows that if the price breaks the recent support then it will go down more in the upcoming time. Major reliable indicators like EMA, RSI, and MACD give negative signals about Pfizer Inc. stock. Fear is developed among investors due to the consistently poor performance of the coin. Pfizer Inc. stock is not showing any recovery signs right now.
Disclaimer
The analysis given in this article is for informational and educational use only. Do not take this information as financial or trading advice. Trading and investing contain financial risk. Before making any investment or trading decision, please consider your risk profile and circumstances.
Comments