The NEAR Protocol token is primarily used to defray transaction fees and provide security for blockchain-based data storage. It also awards coins to a number of blockchain participants. Transaction validators are compensated for their efforts with tokens per epoch, equal to 4.5% of the total NEAR supply.
The makers of smart contracts also receive a portion of the transaction fees generated by their creations. The remainder of each transaction fee is burned, increasing the scarcity of the NEAR Protocol token. It has also established a protocol treasury, which receives 0.5% of the whole supply year, to reinvest in the ecosystem’s expansion.
NEAR Protocol Prices:
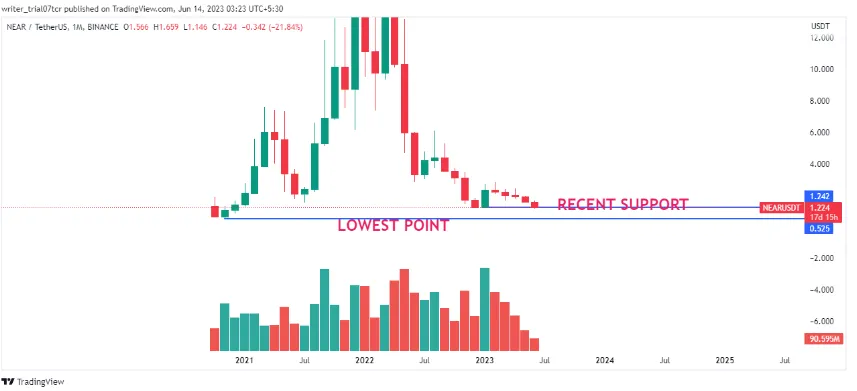
Nearly hits its birth price of 1.300, which is now at 1.227. Falling from its high of 19.788, which is almost 93% down from the peak.
Is the price returning to its birth price or dropping to its all-time low of 0.52?NEAR Protocol Price has dropped about 93% from its peak and is very close to its listed rate. We attempt to spot a reversal in a smaller time frame after seeing that the stock is in a negative trend on a bigger time scale. Bulls entered the market heavily in the previous month of January, so we can assume that this level serves as support on a closing basis. If the price breaches this level, however, we will notice that the market is NEAR at its lowest point.
NEAR Protocol ANALYSIS of Charts:
NEAR is up 7.5% this month even after a dip that tracks the bigger market. It is straightforward to build atop NEAR Protocol (NEAR) because to its widespread use and several exciting collaborations.
- According to our live NEAR to USD pricing update, the price of the Near Protocol is currently $1.4 USD.
- According to our price prediction for the Near Protocol, the price of NEAR may decrease by -20.74% by July 9, 2023.
- The market is now 83% bearish and has a fear and greed index score of 55 (greed), based on our analysis of the technical indicators.
- In the last 30 days, there have been 13/30 (43%) green days and 7.49% price volatility for Near Protocol.
WEEKLY–
Prices on the weekly chart follow a trend line that acts as resistance. Weekly is also at the support level. However, if we see that the price is in the bottom band of the Bollinger band, it might occasionally serve as a support level. Additionally, we observe little volume activity in it and low volatility in the Bollinger band, indicating a lack of interest from buyers and sellers in NEAR.
DAILY –
The price of NEAR is close to its key support zone, as seen on the daily chart. After forming a bearish engulfing candlestick pattern and the price continues to decline from the taking resistance trend line, the RSI on the daily chart is 24.80, indicating that there is bearishness in the currency. If the price breaches the support level on the daily chart, we recommend shorting this currency since the support level that follows it is the lowest it has ever been.
4 HOURS –
Bulls are attempting to drive the price upward as NEAR enters a phase of consolidation in the 4-hour time frame. The price will move upward till the next resistance level if it breaks the high and closes above the range. Additionally, the currency closes above the 9 EMA line, indicating short-term bullishness. The 9 ema displays the stock, coin, or index’s short-term trend.
HOURLY –
We can see that the price is seeking to break beyond the 10-to-50 range on the hourly chart. If the price breaks through and holds the 1.239 level, it will go on upward to the next resistance zone, which is the 200 ema.
IS NEAR Protocol bullish or bearish???
Although the currency is in a negative trend over the long term, we can see that it is approximately 90% accurate from its high level in the NEAR. Additionally, we can see that the 10-50 crossing was completed in the hourly chart.
TECHNICAL LEVELS –
- RSI –
Monthly – 44.21
Weekly – 34.47
Daily – 24.68
4 hours – 40
1 hour – 55.18
So we say in the short term price has the strength to go upside but in bigger charts, the coin shows bearishness.
- MACD
- MACD in the weekly chart shows bullish strength with the 0.01 level
- Daily it shows bearishness with a -0.012 level also MACD line crosses the signal line in the daily chart.
- As same as RSI, MACD also shows bullishness in a small time frame.
- BOLLINGER BAND
Upper band Lower band
- Monthly- 13.777 -3.109
- Weekly – 2.635 1.208
- Daily – 1.801 1.169
Prediction
According to a review of NEAR Protocol pricing from prior years, it is predicted that the protocol would cost at least $2.34 in 2024. The price may reach a maximum of $2.77. The typical trade price in 2024 maybe $2.42 dollars.
- ROI potential: 203.7%
Price Prediction for NEAR Protocol in 2030:
Cryptocurrency specialists are prepared to provide their predictions on the pricing of the NEAR Protocol. The $28.88 maximum price will define the year 2030. However, it may decrease to around $23.82. Therefore, $24.66 is the anticipated average trading price.
CONCLUSION
There is no recommendation to go long in this coin because it is in a negative trend over a longer time horizon. A minor upward movement in the coin is still probable despite this, therefore you should go along with a strict stop loss.


Comments