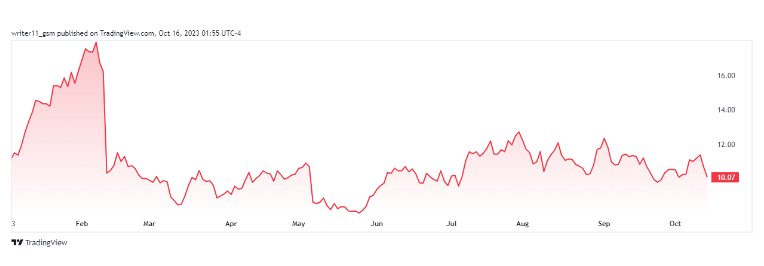
- LYFT stock price has declined by 13% in the last two trading sessions.
- Lyft Inc. has recently announced the resignation of its two board members.

Lyft Inc. (NASDAQ: LYFT) offers a variety of services like mobility, ride-sharing, giving vehicles for hire and also makes motorized scooters. It is an American company that was founded in 2007. The current CEO of the company is John David Risher and it has 4.419K employees.
Lyft Inc. does not provide any dividend to its shareholders and has a current market cap of $3.889 Billion. The EPS for LYFT stock has dropped to -$3.57, indicating that the company is experiencing losses when compared to its earnings per share for each share.
LYFT stock has 377.635 Million shares freely floating in the market while 55.186 Million shares are closely held by investors. This accounts for 14.61% of the total shares available in the market. The current PE ratio of LYFT stock is 48.22.
The ROE of LYFT is 34.79% and it has an operating margin of 34.70%. The stock also has a very good price-to-book value of 15.86. Lyft Inc.’s current ratio is 1.25 which makes it capable enough to repay its debt.
Lyft Inc. Stock Performance Analysis

Source: Tradingview
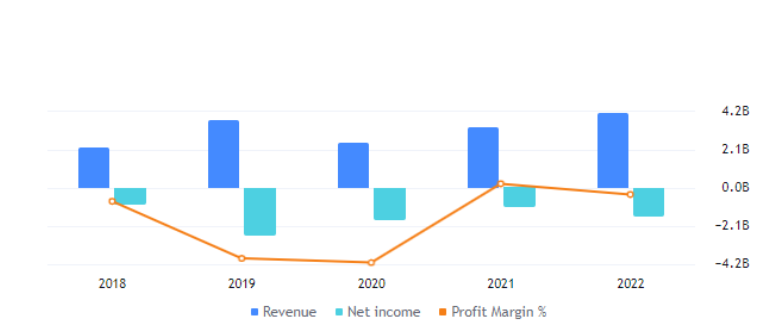
Lyft Inc. has reported a total revenue of $4.10 Billion and incurred a loss of $1.58B which is 38.69% of the revenue. The revenue for the company has advanced by $0.89 Billion when compared to the year 2021. The company also reported a debt of $1.10 Billion and this resulted in a further decline in free cash flow.
Price Targets For LYFT Stock

Source: Tradingview
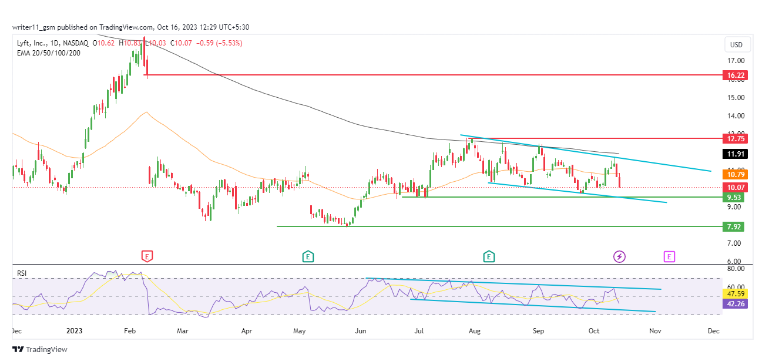
LYFT stock is currently in a downtrend, and many of the technical indicators on the charts are bearish. This includes multiple moving averages and oscillators, which are signaling a bearish outlook on LYFT’s daily chart.
LYFT Stock Is Preparing To Break Below The Falling Wedge

Source : LYFT: 1D: NASDAQ
The LYFT stock price has been following a very strong downtrend for a very long time. The stock price witnessed a huge surge of 80% in January 2023 and then the price again started to decline to lower levels. LYFT stock opened with a huge gap down of 30% on 10th February 2023. This showed that the sellers are consistently dominating over the stock.
In the most recent scenario, the LYFT stock price is still declining following a falling wedge pattern. It has recently made two strong bearish candles, witnessing a decline of more than 10% in price in just two days.
With consistent decline in the stock price, the 50-day and the 200-day EMAs are forming a death cross on the daily chart. The price has also declined below the EMAs. This can take the price to further lower levels.
The RSI indicator for the LYFT stock is trading in a volatile range following a wedge pattern. We must also wait for the RSI to break below the wedge pattern for further confirmation of the price trend.
Conclusion
The technicals for the LYFT stock are totally bearish on the charts. Despite the advance in revenue, the stock price is consistently declining. The indicators are indicating a sell signal.
LYFT stock is currently trading within a falling wedge pattern. If the stock price breaks below this pattern, it may experience a significant decline. However, if there’s a breakout above the pattern, it might not result in strong upward momentum.
Technical Levels
- Support levels- $7.90 and $9.50
- Resistance levels- $12.70 and $16.20
Disclaimer
The information provided in this article, including the views and opinions expressed by the author or any individuals mentioned, is intended for informational purposes only. It is important to note that the article does not provide financial or investment advice. Investing or trading in cryptocurrency assets carries inherent risks and can result in financial loss.


Comments