
- iExec RLC Price Prediction highlights the downfall of the prices as it breaks key support
- RLC Token delivered a growth of 29.21% in one year.
iExec RLC Price Prediction depicts the bearish sentiments of the market as the prices continue to slide to the lower levels. RLC Token is trading at $1.365. The Market is up 1.29% in the last 24H. The 24H volume dipped 41%. The overall market cap of RLC Token is $98,905,491.
iExec RLC Price Prediction: Price creates lowe low
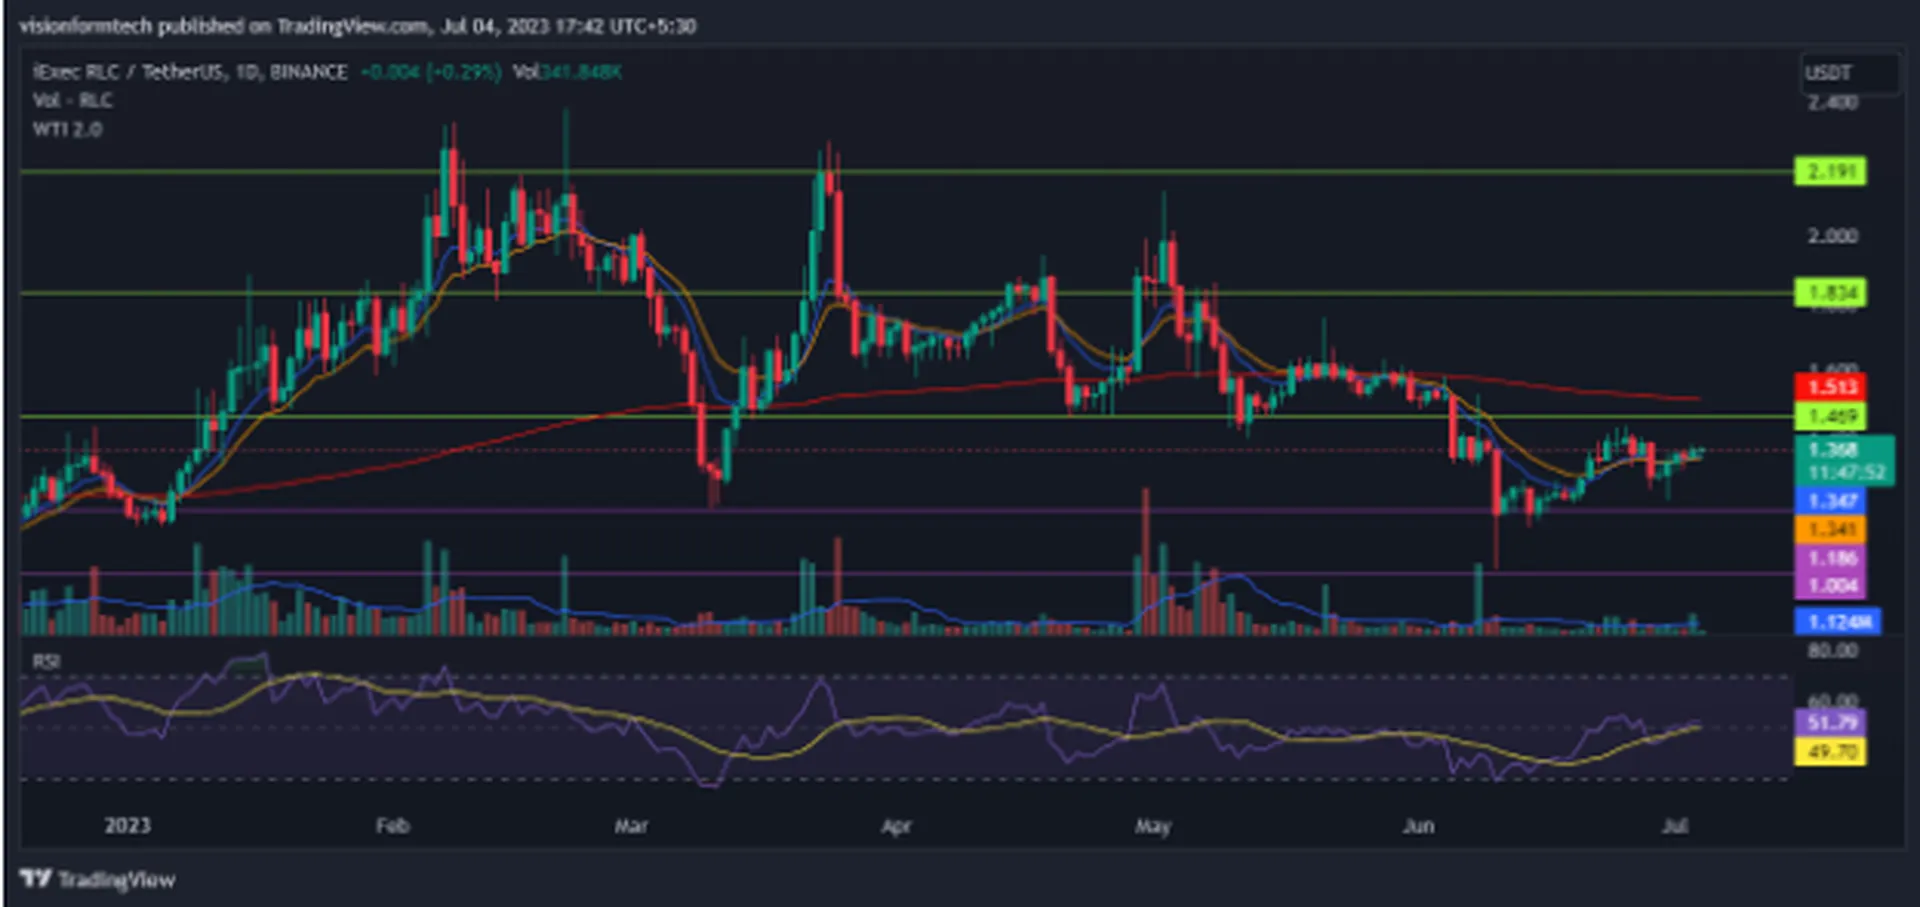
Source: RLC/USDT by Trading View :https://www.tradingview.com/x/AjUDjs1g/
RLC token trading in a bearish trend. The daily chart shows that RLC Price started a bullish rally in the month of November last year. Over the course of 4 months, the price witnessed a growth of almost 165%. Price started declining in February after facing resistance of $2.2.
iExec RLC Price Prediction highlights the bearish consolidation phase of the market. The prices fell in February to a key support of $1.186 and made a second attempt to break the resistance of $2.28. As the Bulls failed Prices kept falling and briefly breached the support of $1.186 which was followed by a quick recovery.
A fight to break the resistance. : Technicals
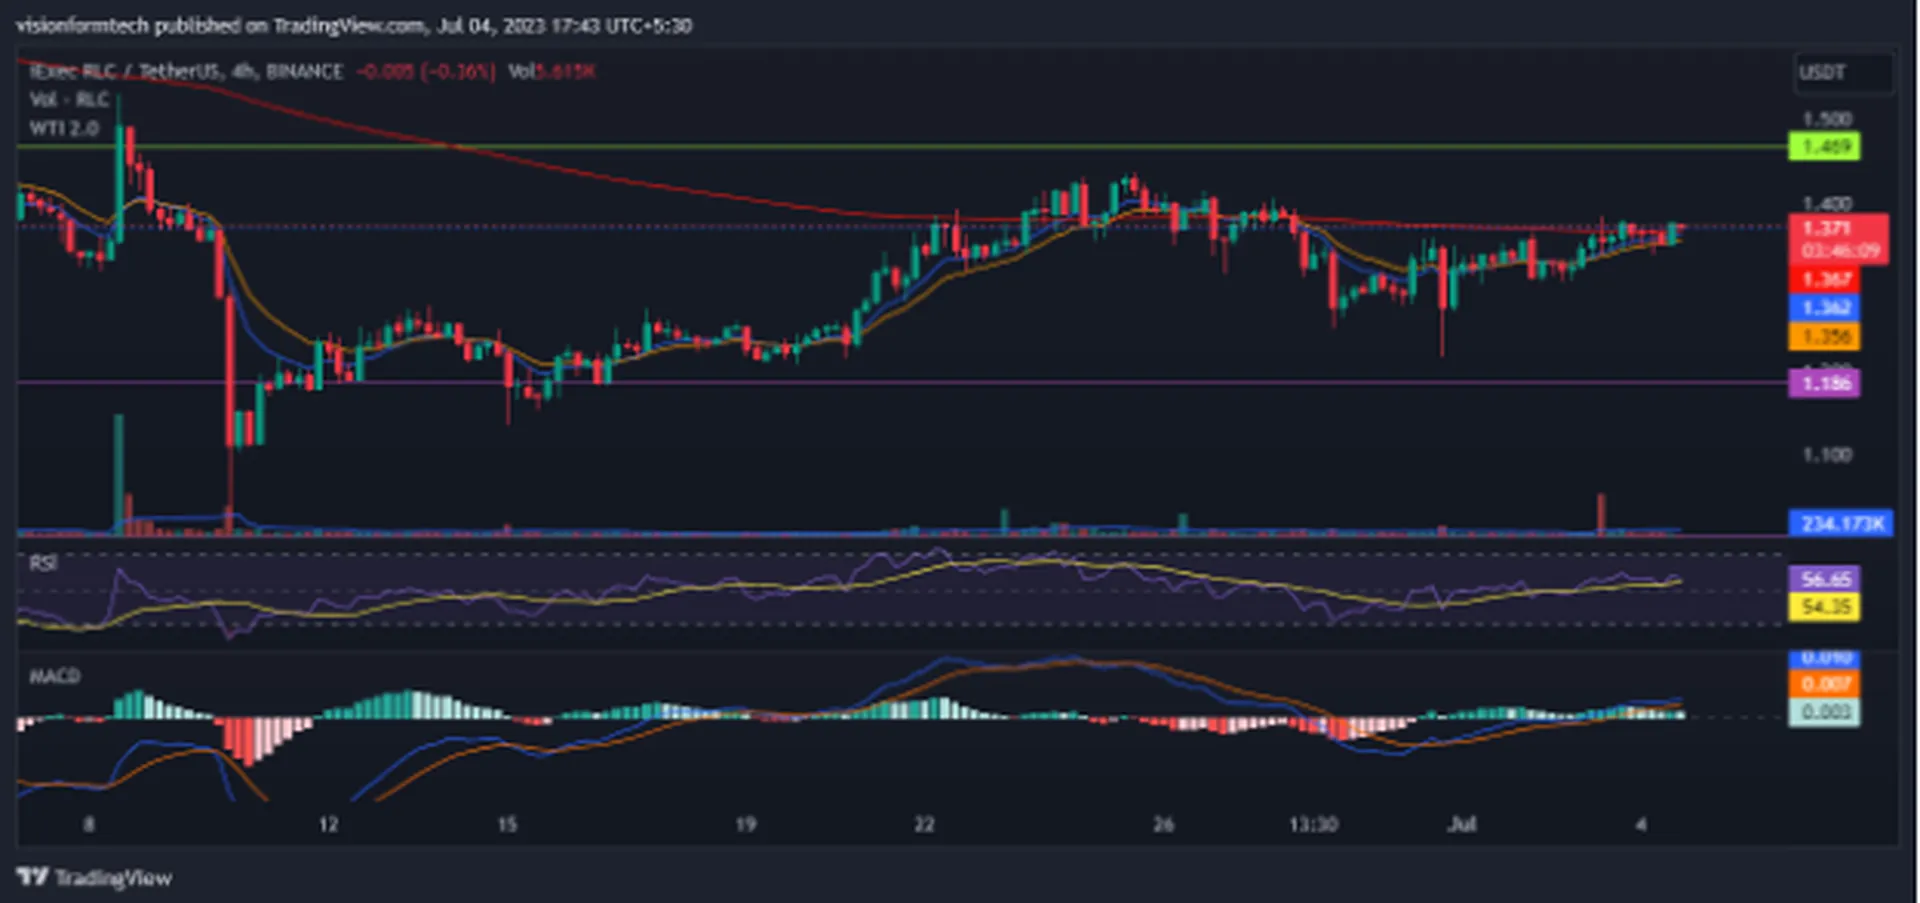
Source: RLC/USDT by Trading View: https://www.tradingview.com/x/7LWhq3oN/
The 4h chart delivers the sight of a minor uptrend as a result of the recovery from its recent swing low. RLC Crypto managed a recovery of almost 30%. The market is slowly approaching the resistance level of $1.469. A break of this level is crucial in order to ensure a continuation of this recovery to higher prices
iExec RLC Price hovers around the 200 EMA. The prices may get resistance here as the bears would be waiting with their sell orders. A drop from here could bring in some added sell-pressure and prices may fall down to test the lower levels. Technical indicators are pointing at a loss of momentum and a sideways market.
RSI:
The RSI indicator is currently at 54.82 on the 4H. This represents that the market is in sideways conditions
MACD:
MACD is getting closer to the zero line. But the histogram indicates lack of momentum and a sideways market.
200 EMA:
As observed, on the 4hr, the prices are trading extremely close to the 200 EMA. This is a common sight in a sideways market.
Conclusion:
iExec RLC Price Prediction depicts the bearish sentiments of the market as the prices continue to slide to the lower levels. A recent bounce may come as a relief but the danger is far from over. The Bulls need to break the resistance to flip the trend bullish. Investors should consider a good risk management strategy amidst the volatile market conditions.
Technical levels
Support Levels: $1.186 – Support 1
$1.004 – Support 2
Current Price: $1.365
Resistance Levels: $1.469 – Resistance 1
$2.20 – Resistance 2
Disclaimer:
The views and opinions stated by the author, or any people named in this article, are for informational purposes only and do not establish financial, investment, or other advice. Investing in or trading crypto assets comes with a risk of financial loss.
Comments