

Home Depot, Inc. closed the trading session on Monday at $307.89. Prices surged by 2.35%. The stock saw a weekly rise of 1.17%.
- HD Stock lost 3.95% in the last 6 months.
- HD Stock returned 10.96% in the last year.
Home Depot, Inc. has been trading in a range-bound market since February. The market kept bouncing between the range of $280-$304. This served as the ideal conditions for swing traders and short-term investors. HD stock is in a mid-term consolidation phase after falling from its all-time high of $420.94.
The Stock forms a double-bottom structure
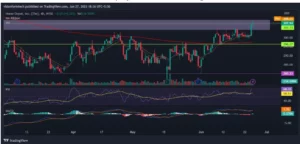
Source: HD by TradingView: https://www.tradingview.com/x/MRjlO7ml/
On the Daily Chart, Home Depot, Inc. appears to be forming a double-bottom structure. This pattern has a bullish target of 7.5% which can shoot the prices to the $330 range. The trading session on Monday closed with a Bullish Engulfing candlestick pattern. This allowed the price to close above the range which the market had maintained since February.
HD Also managed to close above the 9, 15, and 200 EMA. All these factors increase the
probability that the stock is ready to break the range and ascend to the resistance level of $330. The stock appears to be bullish due to the formation of a higher high. The RSI on the daily level is 63.56, which points to the strength in the market.
The 4H chart displays the range-bound market.
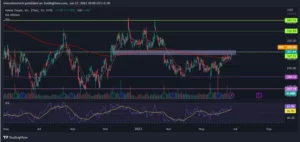
Source: HD by TradingView:https://www.tradingview.com/x/FNzpcvDd/
The 4H chart unveils the price action of a range-bound market. HD stock has been trapped in this range for the past few months. Meanwhile, June brought in some bullish action as the price was riding the waves of 9 and 15 EMA. The Market flipped the 200 EMA, which showcases the emerging strength of the buyers.
HD is trading at a critical resistance. If the price sustains above this level for this week, It will unlock a possibility of a Bullish start to July. A rejection from here can bring down the price, where the first line of defense will be $296.00, which aligns with 200 EMA as well. The technical indicators are pointing towards a bullish scenario.
RSI:
The RSI indicator is currently at 68.33. It represents Strong bullish conditions
MACD:
The MACD indicator is Attempting a bullish crossover above the 0 line. This suggests bullish price action
200 EMA:
As observed, on the 4hr, the price is trading above the 200 EMA(exponential moving average) which acts as a significant support. This is a clear indication of an uptrend where the buyers are in control, and for a trend reversal, the price must break and trade below the 200 EMA.
Technical levels
Support Levels: $296- Support 1
$280- Support 2
Current Price: $307.89
Resistance Levels: $330.59
Conclusion:
Home Depot, Inc. had a rough start to the year as the market decided to correct from the all-time high. The price is getting consolidated in a range-bound market. While it may frustrating to long-term investors, Short term and swing traders are making the best out of it. HD stock is slowly making its way out of the range. Some bullish price action has grabbed the attention of Buyers as the price may have higher chances of breaking the range and moving to higher levels. It is always important to consider the negative scenarios and also be prepared with solid risk-management plans.
Disclaimer
In this article, the views and opinions stated by the author or any people named are for informational purposes only, and they don’t establish investment, financial, or any other advice. Trading or investing in cryptocurrency assets comes with a risk of financial loss.


Comments