

- General Motors’ stock price rose above the 50, and 100-day Exponential Moving Average.
- General Motors’ stock price is currently trading at $39.30.
- General Motors (NYSE: GM)’s live market cap is $54.63 billion.
A well-known American automaker with a long history in the sector is General Motors (NYSE: GM). With a considerable presence both domestically and internationally.
General Motors has made a name for itself as one of the largest automotive companies in the world. Investing in cutting-edge technologies and long-term mobility solutions has always been a goal of General Motors.
Trend Analysis
General Motors Company is currently exhibiting signs of uptrend momentum in the daily timeframe. The price is forming a higher high pattern
After reaching a high of $42.34, the price of GM dropped sharply, dropping by 50% in just five months. However, this downward trend found support around the price of $30.64, which led to a subsequent price increase.
As a result, the price started to fluctuate within a predetermined range, which led to the development of a parallel channel pattern. Price confinement within this channel at the moment suggests a potential breakout over the $43.26 resistance level. The creation of the entire structure demonstrates that GM stock has a promising future and the price is likely to move in an upward direction.
However, it is crucial to exercise caution and wait for a confirmed breakout before considering taking positions that are long because if the price fails to break through the resistance level, it may continue to consolidate inside the channel.
The net profit of the General Motors Company has increased from $979 Million to $2.79 Billion in the last two quarters with an average of 59%. This indicates that the stock has gained a huge profit percentage and this might gain the buyers’ interest.
General Motors (GM) Stock: Price Analysis
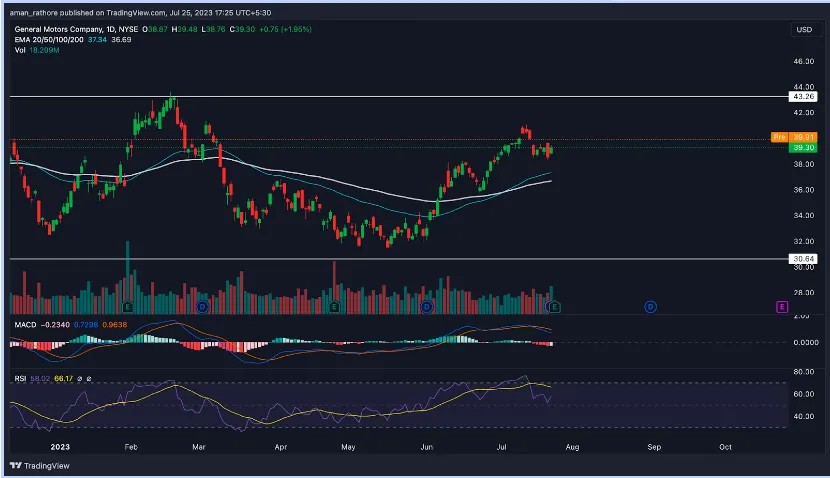
Source: GM/USD.1D.NASDAQ by TradingView
The increasing volume of General Motors’ continuous price action also suggests increased market activity and potential buyer interest. The stock’s value may increase as a result of the volume increase.
Additionally, technical indicators confirm the strong trend witnessed in GM. A bullish trend appears given that the EMAs of 50-day and 100-day are all trading below the current price.
Further supporting the upward trend is the Moving Average Convergence Divergence (MACD) indicator’s bullish pattern which displays the MACD line above the signal line.
The Relative Strength Index (RSI) which has not yet crossed into the overbought region also suggests the possibility of additional price gains.
Conclusion
As per the analysis, General Motors (NYSE: GM) is currently experiencing an uptrend momentum and the net profit has significantly gone up. The indicators are favoring this uptrend momentum and the price is likely to rise above in the upcoming as the overall structure and chart pattern is strong.
Technical Levels
- Support Level – $30.64.
- Resistance Level – $43.26.
Disclaimer
The views and opinions of the author, or anyone named in this article, are for informational purposes only. They do not offer financial, investment, or other advice. Investing or trading crypto assets involves the risk of financial loss.
Comments