

- Fantom(FTM) price is trading at $0.2606 with a decline of -5.18% in the last 24 hours as per CoinMarketCap.
- The current Fantom(FTM) ranking on Coingecko is #57 as of 10 July 2023 with a fully diluted valuation (FDV) of $828,270,339.
- The current Volume/Market Cap ratio of FTM is 0.1174.
The all-time high for FTM is $3.46 and it is currently trading at a decline of -92.45% from the all-time high.
Fantom crypto is the digital currency of the Fantom network, a distributed platform for programmable contracts and digital assets. The Fantom network employs its own consensus mechanism, named Lachesis, which relies on a directed acyclic graph (DAG) architecture.
Fantom(FTM) reached its peak value of $3.46 on Nov 21, 2021 (Over a year ago). The current value is -92.45% below the highest value ever and FTM has declined by -17.08% in the past week. There has been an advance of +14.29% in the trading volume of FTM resulting in $208.19M in the last 24 hours as per CoinMarketCap.
Fantom(FTM) Volume/Market cap liquidity in the last 24 hours is 10.57% as on 10 July 2023 as per CoinMarketCap.
Fantom Technical Analysis
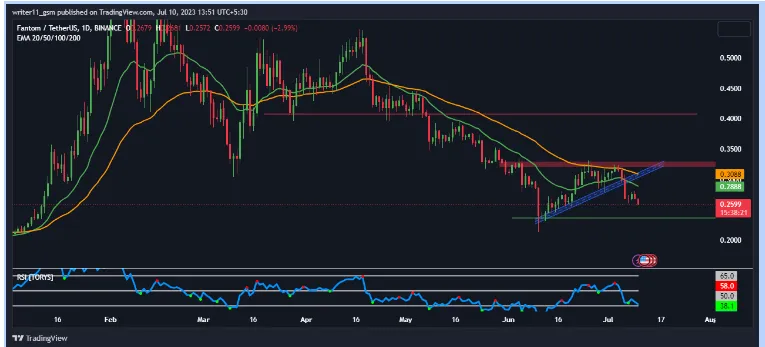
Source: FTMUSD.BINANCE.1D by TradingView
Market Structure: FTM has been consecutively in a downtrend for a long time and has been consecutively making new lower lows by sustaining below the moving averages. In recent times it started to rise after making a low of 0.2127 but could not sustain on the higher levels and started to make lower lows again by taking rejection from the 50-day Exponential moving average.
FTM Indicator Analysis
Source: FTMUSD.BINANCE.1D by TradingView
EMA:
Based upon the current charts the market is currently trading in the bearish crossover of 20 and 50-day exponential moving average and moving downwards following a downtrend.
RSI:
Based on the current chart the RSI is trading below the level of 50 after making lower lows. The RSI tried to move upwards but was unable to break the level of 65 which represents the weak strength of buyers in the market which resulted in a further fall in Fantom(FTM).
Conclusion
Based on the charts we can see that the market is moving downside following a downtrend resulting in a bearish crossover and RSi below the level of 50.
Hence, all these factors represent weakness in the chart of Fantom(FTM) which indicates that we can see lower prices in the upcoming days.
Technical Levels
- Support Level – 0.2352
- Resistance Level – 0.3233 and 0.4076
Disclaimer
The information provided in this article, including the views and opinions expressed by the author or any individuals mentioned, is intended for informational purposes only. It is important to note that the article does not provide financial or investment advice. Investing or trading in cryptocurrency assets carries inherent risks and can result in financial loss.
Comments