

Bone was recently listed on the OKX exchange. The listing pumped the asset price by 50%, recording an all-time high of $1.20. The price couldn’t sustain for very long, and the market collapsed by almost 45%.
- BONE/USDT is up 2.04% as of today’s trading session
- BONE/USDT made a recovery of almost 15% from its recent dip
BONE/USDT is trading at $0.7620 at present. The price created a new all-time low at $0.659 just months after its all-time high. The asset is relatively new on the exchange and was recently made available for the general public to trade. It’s a usual pattern to see a pump while listing a token on any exchange followed by a dump. This is because early investors are booking profits and taking some money off the table.
The Daily chart shows a bearish market structure.
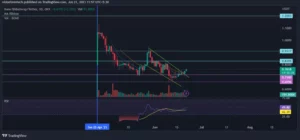
Source: BONE/USDT by TradingView: https://www.tradingview.com/x/tCbTY4kP/
The Daily chart represents a bearish market structure as the price created a lower high followed by a lower low. Investors must keep note that the digital asset is new. Performing technical analysis on such an asset is relatively difficult due to a lack of data. According to the market structure, the price briefly formed a pattern that appears to be a declining channel.
The price escaped this channel while contributing to its probability of an upside move. This has a potential of almost 25% to the price of $0.909, a daily resistance. Such a move can fuel the momentum that can take BONE back to $1. The price was taking support at $0.7180 and managed to close above the 9 and 15 EMA on the daily timeframe. RSI is signaling a divergence but its credibility can be questioned due to the lack of data.
The 4H chart shows a potential bear flag
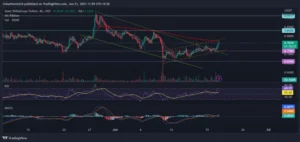
Source: BONE/USDT by TradingView: https://www.tradingview.com/x/CJFwUDYn/
As we look closer, the 4H chart gives us a clear picture of short-term action. The price managed to break out of this channel but is still below the 200 EMA on the 4H. This means the bears hold the potential to flip the market at any point and investors must strategize their risk management plans accordingly.
The Price action is steadily moving upwards in an ascending channel. This appears to be a formation of a bear flag which is a common continuation pattern in a downtrend. Investors should embrace themselves for a downhill ride if the price breaks below the $0.7180 level. The target of this bear flag is almost 17% which will create a new all-time low.
RSI
The RSI indicator is currently at 69.90, and the RSI has crossed the MA line towards the downside This is a sign of bullish strength.
MACD
The MACD indicator appears bullish due to the crossover above the 0 line.
200 EMA
As observed, on the 4hr, the price is trading below the 200 EMA(exponential moving average) which acts as a significant resistance This is a clear indication of a downtrend where the sellers are in control, and for a trend reversal, the price must break and trade above the 200 EMA.
Technical levels
Support Levels: $0.7180 – Support 1
$0.6596 – Support 2
Current Price: $0.7620
Resistance Levels: $0.8305 – Resistance 1
$0.9117 – Resistance 2
Conclusion
BONE is trading in a bearish price action. The price must make a higher high above $0.9117. This will confirm the change of trend and the market can target new highs. At present, the price is still below the 200 EMA on 4H. It is indicating that bears still have an edge and the investors shouldn’t be surprised to see lower prices. Bone is relatively new and the investors must factor in the fundamentals along with technicals to make sound investment decisions while following a good risk management plan.
Comments