

Trust Wallet is a non-custodial mobile Bitcoin wallet that was created in 2017. It provides a wide variety of functions and allows users to access a huge number of blockchains, digital assets, and DApps. Trust Wallet also has its own governance token, TWT, which lets holders vote on major governance issues. Trust Wallet is Binance’s official decentralized wallet, making it a safe and secure alternative for consumers.
The bearish Chart converges to 0.85 from 2.34
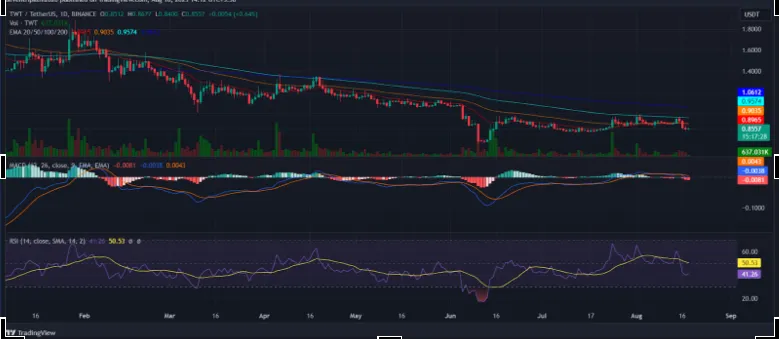
The current price of Trust Wallet Token is $ 0.856917, with a 24-hour trading volume of $ 14.85M, a market size of $ 357.03M, and a market dominance of 0.03%. TWT’s price has dropped -2.81% in the last 24 hours. Trust Wallet Token achieved its greatest price on November 14, 2022, when it traded at an all-time high of $ 2.73, and its lowest price was recorded on June 9, 2020, when it traded at an all-time low of $ 0.002771. The lowest price since the all-time high was $ 0.713506 (cycle low). Since the last cycle low, the greatest TWT price was $ 0.986200 (cycle high).
Successful Indicators are analyzed in the chart
The cryptocurrency’s current value has dropped by -2.31% in the last 24 hours. When we compare the current TWT market cap to yesterday’s, we can notice that the market cap is likewise down.
Trust Wallet Token is having difficulty competing with other cryptocurrencies. In the previous seven days, the TWT has fallen by about -5.57%. The currency has been demonstrating risky framing segments over the previous several days; the coin may have excellent fundamentals, but we do not believe it will be a successful asset in the short run. TWT’s price has dropped by -36.130% in the last month, subtracting a stunning average of $0.49 from its present value. This abrupt drop indicates that the currency is now in a slump, indicating that it might be an excellent purchase opportunity for a quick investment.
Trust Wallet Token has dropped by -40.50% in the last four months, with the maximum average price of the currency being around $1.44 and the minimum average price being around $1.34.
Indicators:
The TWT Relative Strength Index (RSI) is 11.16, indicating that the market is in a neutral state and the Trend Strength Indicator (ADX) is 20.26, indicating a Buy. The Commodity Channel Index (CCI) is at -165.95, indicating a Sell signal and the Price Rate of Change (ROC) is at -6.86, indicating a Buy.
On the Daily Chart:
TWT Moving Averages Convergence Divergence (MACD) indicator is 0.0043, indicating is a Sell.
TWT’s 100-day exponential moving average is 1.06, while the share price is $0.85, indicating a Buy.
TWT’s 50-day exponential moving average is 1.24, while the share price is $0.85, indicating a Buy.
Trust Wallet Token has support levels of $ 0.831047, $ 0.810693, and the strongest at $ 0.783363 based on today’s classical pivot point (P1) of $ 0.858377. Similarly, the resistance levels for Trust Wallet Token are $ 0.878731, $ 0.906061, and $ 0.926416.
Conclusion
TWT’s stocks are totally bullish market, some sideways data are saw in between. The EMA 20/50/200 all are going bullish since year. So we should go for bullish trades.
Technical levels
- Resistance levels: 0.96 USD
- Support levels: 0.72 USD
Disclaimer
The views and opinions stated by the author, or any people named in this article, are for informational purposes only. They do not establish financial, investment, or other advice. Investing in or trading crypto assets comes with a risk of financial loss.
Comments