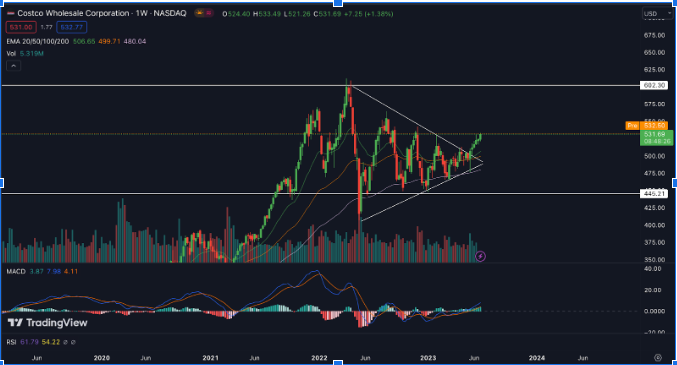
- Costco Corp. stock price has sat above the 20, 50, and 100- days Exponential Moving Average.
- Costco Corp. stock price is currently trading at $531.69.
- Costco Corp. (COSTCO) live market cap is $236.62 billion.
An international retail company called Costco stock price Wholesale Corporation, also known as Costco, runs a network of warehouse clubs open to members only. As one of the most prominent and prosperous merchants in the world, Costco was founded in 1976.
Groceries, electronics, appliances, furniture, apparel, etc., are among the numerous things that Costco sells. Consumers must pay an annual fee to access the company’s warehouses and benefit from the wholesale pricing offered on a wide range of products.
Trend Analysis
As per the chart, the COSTCO stock price clearly shows it is experiencing strong rising momentum. A substantial shift in market mood was evident as the price successfully exited a symmetrical triangle pattern and created an engulfing pattern.
Costco’s historic $612.27 high, a significant resistance level, was attained in April 2022. After reaching its peak, the price entered a corrective phase and formed a triangle pattern with lower highs and higher lows. With only a 15% difference, Costco’s price is still reasonably near its all-time high despite this consolidation.
There are vital signs of a likely upward continuation when considering the overall pattern and structure seen on the chart. The breakout from the symmetrical triangle supports the idea of bullishness. However, it is essential to note that the price can see a brief retracement or pullback. This is especially true given the lack of a substantial corrective move following the breakthrough.
Consequently, the general sentiment points to a favorable uptrend for Costco’s price, with a higher likelihood that it will resume its upward trend.
Costco Corp. (COSTCO) Stock Price Analysis

Source: COSTCO/USD.1W.NASDAQ by TradingView
EMA
Costco Corp. (COSTCO) stock price is trading above the 20, 50, and 200-day EMAs weekly, indicating the price to move above in upcoming days.
MACD
COSTCO stock price, MACD line is above the signal and forming a green histogram suggesting a positive up move shortly.
Volume Analysis
The volume of Costco Corp. stock is gradually rising, as seen in the charts, which is a positive and reassuring sign for the upward trend of the stock price. This volume spike indicates increased market activity and potential investor interest in Costco Corp. shares.
Conclusion
The substantial breakout from the triangular formation coupled with heavy volume, which is a positive sign for additional upward movement, and several indicators all support the expectation that Costco’s overall momentum will continue in a positive direction.
Technical Levels:
- Support – $445.21.
- Resistance -$602.30.
Disclaimer
The views and opinions of the author, or anyone named in this article, are for informational purposes only. They do not offer financial, investment, or other advice. Investing or trading crypto assets involves the risk of financial loss

Comments