

- HIVE Price Prediction concludes the falling prices of $HIVE since the month of FEB
- $HIVE Coin has lost 48.28% since the last year
HIVE Price Prediction gives an insight into the bearish price action of HIVE Since the month of February. HIVE Crypto is trading at $0.3262. The Market is up 2.00% in the last 24H. The 24H Volume witnessed a jump of 359.24%. The overall market cap of $HIVE Token is $164,174,671.
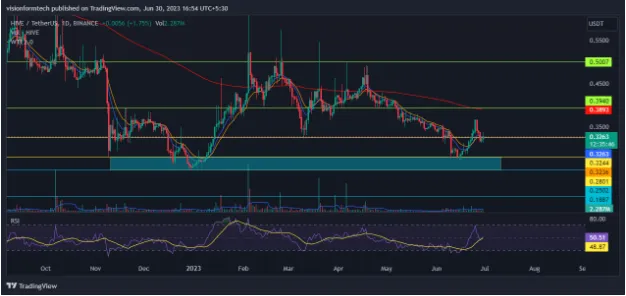
HIVE Price Prediction: A bounce from the key demand zone
@TradingView: https://www.tradingview.com/x/ZoueRFLp/
A thorough analysis of the daily chart concludes that HIVE token is struggling with the bearish sell pressure as the market keeps testing its lows. So far, HIVE has lost 90% in value from its all-time high of $3.43. While this year, prices started slipping from February and the market did lose 46% before witnessing a decent bounce from support.
HIVE Price Prediction suggests that a moderate recovery of 25% from its primary support has revived hopes for the bulls. HIVE Crypto Managed to pierce the resistance level of $0.3244. The Bulls are fighting to hold this level as it may help the price to recover further.
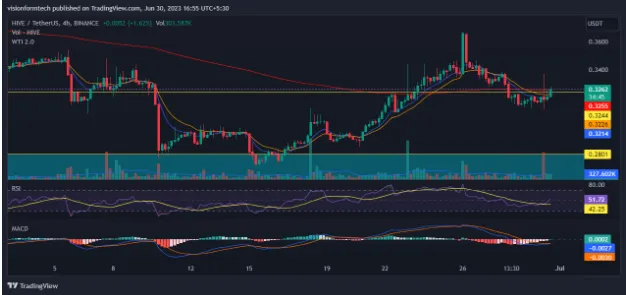
A fight to reclaim higher levels. : Technical Indicators
@TradingView: https://www.tradingview.com/x/ZoueRFLp/
The 4H Charts show that the price has shifted the momentum in the short term. The market is forming higher highs while the volume increases. The Bulls are fighting hard to escape the bearish grips as they push the prices higher. A continuation of this uptrend may force the sellers to stop selling.
It won’t be wise to consider a downfall from here as the overall trend remains bearish. A rejection from here may lead to a decline of 15% to the primary demand zones. The Technical indicators are pointing at a potential shift of momentum. The prices may continue to rise if the market sustains above the current level.
RSI:
The RSI indicator is currently at 52.17 on the 4H. It means the market can be sideways
MACD:
The MACD has made a bullish crossover. The Indicator is planning to move above 0. The market may witness bullish action in the short-term
200 EMA:
As observed, on the 4hr, the price is trading near the 200 EMA(exponential moving average) . It is important to let the prices move away from the indicator to get a clear understanding of the trend.
Conclusion:
HIVE Price Prediction gives an insight into the bearish price action of HIVE Since the month of February. Prices have taken support at a crucial demand zone which may bring hope for investors. The technical indicators are pointing at moderate recovery while the overall trend remains bearish. Investors are getting lured into buying due to low prices and very high upside potential.
Technical levels
Support Levels: $0.2794- Support 1
$0.2509- Support 2
Current Price: $0.3262
Resistance Levels: $0.3490- Resistance 1
$0.500 – Resistance 2
Disclaimer:
The views and opinions stated by the author, or any people named in this article, are for informational purposes only and do not establish financial, investment, or other advice. Investing in or trading crypto assets comes with a risk of financial loss.
Comments