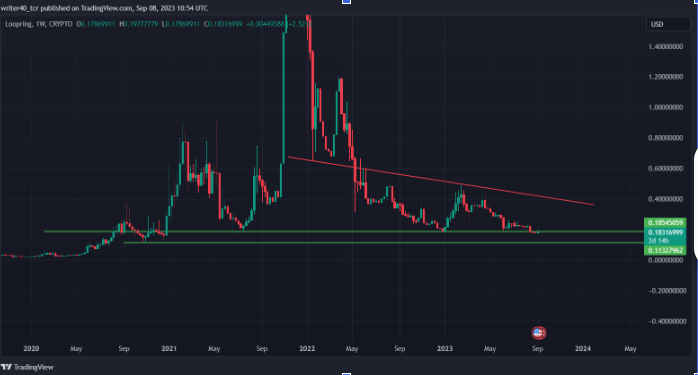
- LOOPRING PRICE IS DOWN BY 95% FROM IT HIGHS .
- LOOPRING PRICE IS CONTINUOUSLY COMING DOWN AND TRADING AT 52 WEEK LOW.
- DOWN BY ABOUT 25 % IN A MONTH AND 46% IN AN YEAR.
MARKET CAPITAL OF LOOPRING – $ 243.9 M
CURRENT MARKET PRICE OF LOOPRING – $ 0.183
Loopring price is currently in a downward trend as the price is trading near to the 52 week low. Price is down by 25% in a month and 46% in a year which is not a good sign for the investors .The price fell below the support levels of $ 0.191 and now the level is acting as a resistance for the price.
Loopring is trading in a range of single candle which was formed on 17 August when it tanked about 15 % intraday and closed the day with 8% downside. At this level the price is forming a base and the support is also standing at the same level i.e $ 0.18 – $ 0.11.

The price is forming a downward sloping trendline where the resistance is standing near to the level $ 0.205 and the horizontal resistance is present at $0.195 and second resistance is placed at $ 0. 255.
The support for the price is present at $ 0.169 levels and which is the low of the strong bearish candle formed on 17 august , second support is present at $ 0.133 and the final support is present at $ 0 .115 levels.

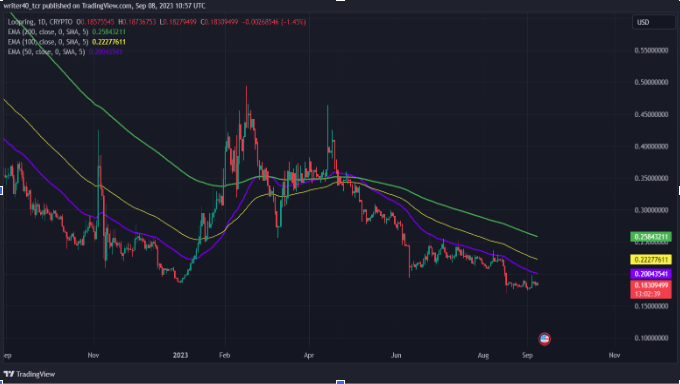
The price is trading below the three major EMAs i.e 50 ,100 and 200. They are currently placed at $ 0. 200, $ 0. 222 and $ 0. 258 respectively. These levels will create a supply zone for the price and it can face some difficulty to cross these levels .
WILL IT BREAK THE RANGE ON UPSIDE OR DOWNSIDE ?
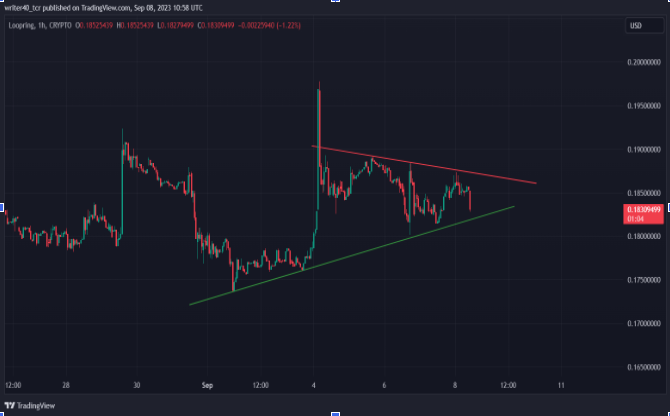
As per the one hour chart the trend is slightly bullish and where it is forming a symmetrical triangle pattern as drawn in the chart below where the resistance is visible near the levels $ 0.187 and the support level is present at the levels $ 0.182 .
Price showed a bullish momentum from bottom level as the price made a gain of 12% in a just 24 hours of trading which indicates that there are some buying happening at the bottom levels.

CONCLUSION : –
As the price is currently forming a symmetrical triangle pattern and if the price breaks the level and sustains on upside then the stock can witness a good up move toward the levels $ 0.202 and if it gives breakdown then we can again witness the lower levels which can be $ 0. 170.
TECHNICAL LEVELS :-
RESISTANCE – $ 0.187 AND $ 0.202
SUPPORT – $ 0 .182 AND $ 0.170
PAST PERFORMANCE –
1 WEEK- 2.36 %
1 MONTH- – ( 18.71 ) %
1 YEAR- – ( 46.37 ) %
DISCLAIMER-
The views and opinions stated by the author, or any people named in this article, are for informational purposes only and do not establish financial, investment, or other advice. Investing in or trading crypto assets comes with a risk of financial loss.


Comments