
Ethereum, often referred to by its ticker ETH, stands as a cornerstone of the digital asset market. Unlike traditional equities, investors cannot purchase “Ethereum stock.” Instead, they trade ETH, the native cryptocurrency of the Ethereum blockchain. Despite this crucial distinction, the phrase “Ethereum stock price” has emerged as a popular way for mainstream investors to track Ethereum’s real-time value, analyze trends, and compare its performance to traditional assets. This article examines Ethereum’s live pricing, historical volatility, technical and fundamental indicators, as well as broader macro trends shaping its trajectory.
Understanding Ethereum’s Live Price Dynamics
Ethereum’s price is continually updated across global exchanges, reflecting 24/7 trading and high liquidity. In practice, this means the ETH price can exhibit dramatic intraday swings that dwarf the typical moves seen in stock markets.
Key Drivers of Price Movements
Price fluctuations in Ethereum result from a blend of factors:
- Market Supply and Demand: With a fixed issuance schedule post-Merge, the token’s circulating supply can impact scarcity concerns and, in turn, push prices up or down.
- Network Activity: Decentralized finance (DeFi) projects, non-fungible tokens (NFTs), and smart contracts require ETH to function, increasing on-chain demand.
- Macro Sentiment: Regulatory news, institutional acceptance, and technological upgrades can cause sudden reversals or price surges. The approval of Ethereum futures ETFs in the U.S., for instance, sparked new inflows from institutional investors.
- Technical Indicators: Traders monitor support/resistance levels, moving averages, and trading volumes to anticipate short-term price action.
Beyond these basics, geopolitical instability, inflation fears, and the U.S. Federal Reserve’s policy adjustments can ripple into the digital asset sector, further driving volatility.
Historical Trends: From ICO Peaks to Mainstream Adoption
Ethereum’s price journey since its 2015 launch offers a case study in exponential growth punctuated by volatility. Early adoption drove significant price appreciation, particularly during the 2017 ICO boom and subsequent cycles.
Major Milestones in Price Evolution
- 2017 Bull Market: ETH rose from under $10 to over $1,300 amidst the ICO mania, only to lose over 80% in the subsequent market correction.
- DeFi Summer (2020): The explosion of decentralized finance protocols renewed Ethereum’s relevance, catalyzing double- and triple-digit percentage gains through mid-2021.
- The Merge (2022): Transitioning from proof-of-work to proof-of-stake drastically reduced Ethereum’s energy consumption and became a foundational shift that many believe will cement its status as “digital infrastructure.”
“Ethereum’s price performance over the years mirrors not only investor speculation but also waves of technical innovation and real utility,” notes Dr. Priya Menon, a blockchain researcher at MIT. “The network’s adaptability has secured its central role in the evolving crypto ecosystem.”
In recent years, Ethereum’s price has tracked narratives around scalability, adoption, and competition from so-called “Ethereum killer” blockchains—most of which have yet to consistently outpace ETH’s network effect or development velocity.
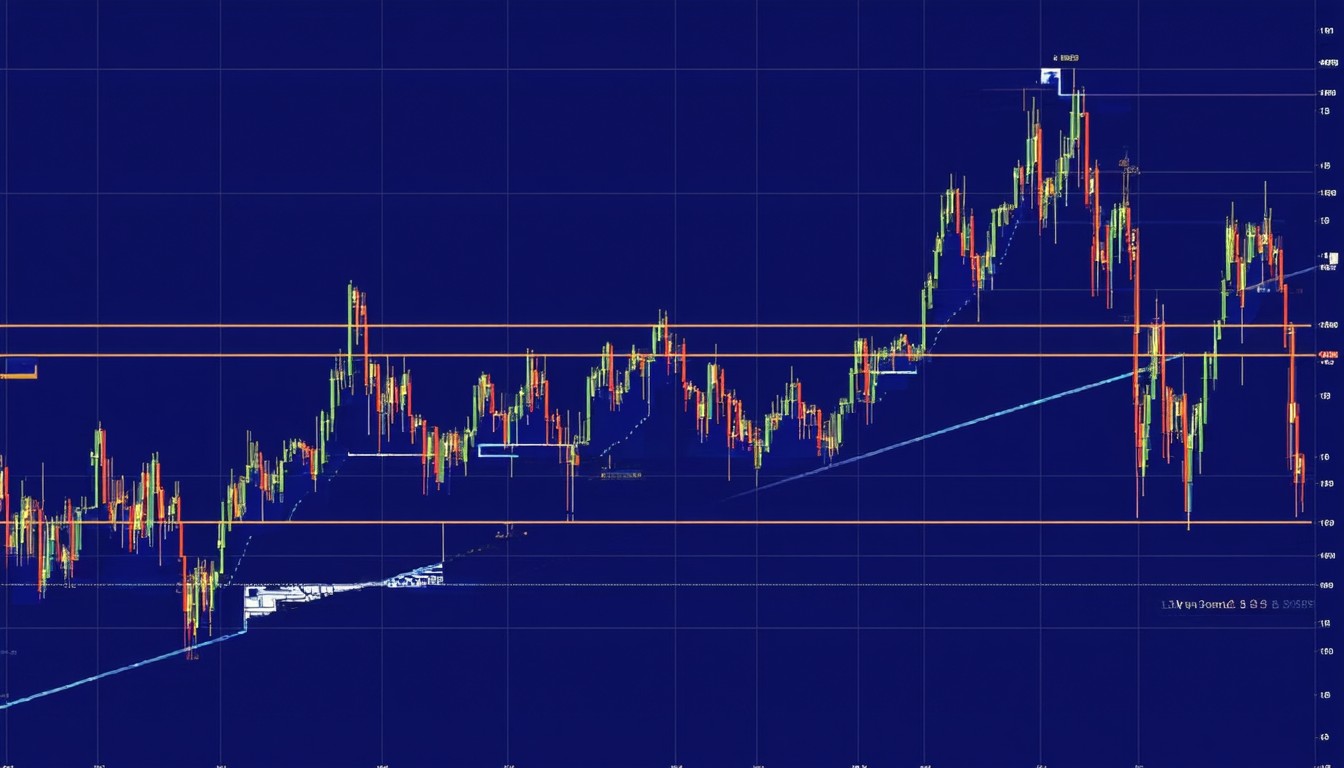
Technical Analysis: Patterns, Signals, and Chart Insights
Technical analysis (TA) serves as a key tool used by both individual traders and institutional analysts to gauge potential price directions. On live Ethereum charts, several TA concepts remain consistently relevant:
Chart Patterns and Indicators
- Moving Averages: The 50-day and 200-day moving averages help mark trends and potential reversal points.
- Relative Strength Index (RSI): High RSI readings can suggest overheated conditions, while low readings may indicate buying opportunities.
- Support/Resistance Levels: Psychological price barriers—such as $2,000 or $3,500—often correspond with increased trading activity and volatility spikes.
Example: Navigating the 2021 Volatility
In 2021, Ethereum’s price repeatedly encountered resistance near the $4,000 level. On several occasions, price corrections were preceded by developing bearish divergence on the RSI, providing short-term traders with actionable signals. When the price broke above this threshold decisively, heavy volume confirmed the trend shift and forced short-sellers to cover, fueling additional gains.
However, TA is not infallible. Unexpected regulatory headlines or technology bugs can “break” otherwise reliable chart formations, underscoring the importance of combining technical, fundamental, and sentiment analysis.
Fundamental Analysis: Ethereum’s Value Proposition
Beyond price charts, Ethereum’s inherent value stems from its role as a programmable blockchain. Its adaptability attracts developers and enterprise consortiums alike, making ETH not just a speculative instrument but also “gas” powering a decentralized economy.
On-Chain Metrics and Network Health
- Active Addresses: An uptick suggests growing user engagement.
- Transaction Fees: High (but sustainable) fees often reflect robust demand but can spark debates about network congestion.
- Developer Activity: Github commits, network upgrades, and protocol proposals signal ongoing innovation.
The rollout of Ethereum 2.0, including sharding and further scaling upgrades, is widely expected to reduce transaction costs and enhance throughput. Meanwhile, major corporations—including banks and global consulting firms—have piloted or launched Ethereum-based solutions for NFTs, supply chain management, and more.
Macro Trends and Institutional Investment
Ethereum’s transformation from a niche technology to a staple of fintech discussions can largely be attributed to institutional acceptance and regulatory clarity.
Institutional Inflows and the Rise of Derivatives
- Futures and ETFs: The introduction of Ethereum-linked futures contracts and exchange-traded funds has made ETH more accessible to traditional investors. These vehicles allow for hedging, speculation, and portfolio diversification without direct token ownership.
- Custody Services: Leading financial institutions—such as Fidelity and Coinbase Custody—now offer secure ETH storage for large investors, addressing longstanding security concerns.
- Enterprise Adoption: Consortia such as the Enterprise Ethereum Alliance illustrate the blockchain’s growing relevance in commercial settings.
This trend is set to continue, provided regulators maintain measured oversight without stifling innovation. Some strategists suggest that, as more institutional capital flows into crypto assets, price volatility may eventually subside—though such effects are not immediate.
Risks, Volatility, and Investor Considerations
Despite its prominence, Ethereum remains a highly volatile asset relative to blue-chip stocks or even gold. Intraday price swings of several percent are not uncommon, and black swan events can lead to double-digit losses in a matter of hours.
Volatility Factors
- Regulatory Risks: Sudden policy announcements can trigger rapid outflows.
- Technical Upgrade Risks: While upgrades like The Merge are necessary, they sometimes create unforeseen bugs or security issues.
- Competitive Landscape: Emerging blockchains with faster processing times or lower fees can divert developer interest and user activity.
Long-term investors should treat Ethereum as a high-risk, high-reward allocation, appropriate only as a portion of a diversified portfolio.
Conclusion
Ethereum’s price story is one of continual evolution—shaped by deep technological shifts, adaptive use cases, and an increasingly global investor base. Live price charts and technical analysis offer dynamic insights, but it’s the combination of robust network fundamentals and thoughtful macro analysis that best equips investors to navigate the market’s inherent volatility. For those considering ETH exposure, patience, research, and risk management remain as vital as monitoring the latest price tick.
FAQs
Is there such a thing as an “Ethereum stock” on public exchanges?
No, Ethereum is a cryptocurrency—not a traditional stock. However, exposure to ETH can be gained via crypto exchanges or investment vehicles like futures and ETFs that track its price.
What factors impact the price of Ethereum?
Ethereum’s price is driven by supply and demand, network usage, technical upgrades, regulatory developments, and macroeconomic trends. Volatility can result from both crypto-sector events and broader financial market movements.
How can I track real-time Ethereum prices?
Real-time Ethereum price data is available on crypto exchanges, financial news sites, and specialized platforms offering live charts, technical data, and price alerts.
Is Ethereum’s price more volatile than stocks?
Generally, yes. Ethereum and other cryptocurrencies experience higher volatility than most blue-chip stocks, with the potential for both rapid gains and sharp losses in short periods.
How does Ethereum’s technology affect its value?
Advancements like scalability upgrades, energy efficiency improvements, and increased adoption of decentralized applications can enhance Ethereum’s underlying value and market appeal.
Are there risks in investing in Ethereum compared to stocks?
Yes, Ethereum carries unique risks including regulatory uncertainty, technical vulnerabilities, and intense competition. Investors should conduct thorough research and diversify their portfolios to manage these risks.