Bitcoin, the world’s first and largest cryptocurrency by market capitalization, has remained both a symbol of digital innovation and a lightning rod for speculative investment since its launch in 2009. One of the most widely followed assets on earth, Bitcoin’s price is constantly tracked in real-time and analyzed through various graphing tools by retail investors, institutional traders, and industry analysts alike. Understanding the bitcoin price graph is essential—not just for making buy-and-sell decisions but also for decoding the larger story of blockchain adoption, global financial sentiment, and technological disruption.
Anatomy of a Bitcoin Price Graph
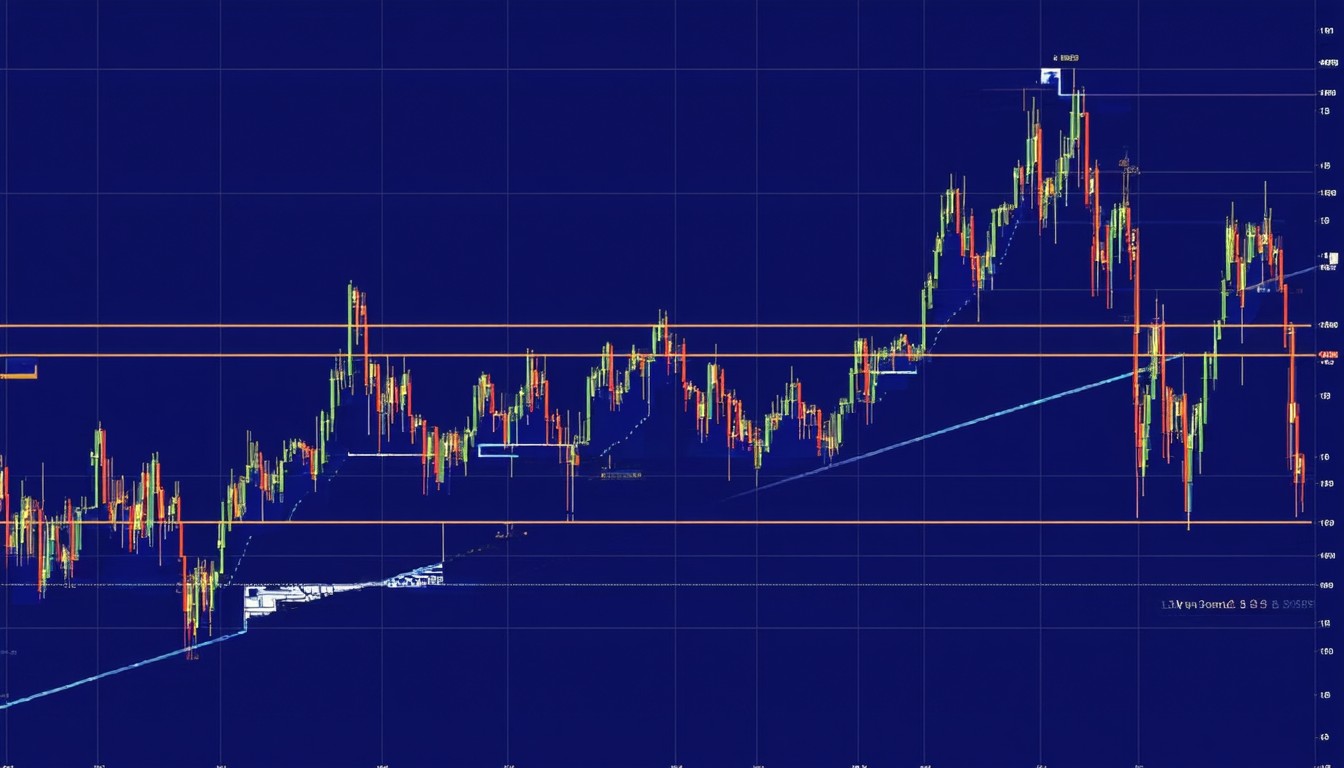
A bitcoin price graph is more than just a line that bounces up and down. At its core, it is a visual tool that captures the complex interplay of market activity, investor sentiment, and macroeconomic events.
Components of a Live Bitcoin Price Chart
The typical bitcoin price chart offers multiple perspectives:
- Timeframes: Ranging from seconds (for day traders) to years (for long-term analysis).
- Price Points: Displaying opening, closing, highest, and lowest prices for each time interval.
- Volume Bars: Indicating the amount of bitcoin traded, revealing momentum and strength behind price movements.
- Indicators and Overlays: Tools like moving averages, Bollinger Bands, and Relative Strength Index (RSI) that help interpret trends.
By selecting different periods—one day, one week, one month, or an all-time view—users can analyze micro patterns or big-picture cycles.
Candlesticks: The Language of Traders
Many bitcoin price graphs use candlestick charts, a format borrowed from the centuries-old Japanese rice markets. Each “candle” on the chart reflects price action for a given period, with colors and wicks indicating bullish or bearish momentum. This visual method helps traders spot patterns like “double tops,” “hammers,” or “morning stars,” potentially signaling a trend reversal or confirmation.
Beyond price and volume, modern charts integrate signals from blockchain data (such as on-chain transfers or wallet activity) and derivatives markets (like funding rates and open interest), connecting market structure with sentiment in real time.
Historical Trends: What the Bitcoin Price Graph Reveals
Over the past decade, the bitcoin price graph has been characterized by volatility punctuated by parabola-like surges and sudden corrections. Yet, patterns often emerge when these dramatic moves are viewed in context.
Major Cycles: Booms, Busts, and Accumulation Phases
Since its first recorded valuation—less than a dollar per bitcoin—the asset has undergone multiple rapid appreciation “bull runs” followed by “bear markets.” Notable cycles include:
- 2013 Bull Run: Bitcoin reached over $1,000 for the first time amid growing media and investor attention.
- 2017 Bubble and Crash: Fueled by ICO mania, the price rocketed close to $20,000 before a rapid correction brought it below $4,000 by the end of 2018.
- 2020–2021 Rally: Institutional adoption, inflation fears, and the DeFi boom propelled bitcoin past $60,000.
- 2022 Correction and Aftermath: Global tightening cycles and regulatory noise contributed to a protracted downtrend, followed by periods of consolidation.
For long-term observers, zooming out on the bitcoin price graph reveals a series of higher highs and higher lows—a form of price appreciation often compared to “digital gold,” but with steeper swings.
Correlation With Macro Events
Bitcoin’s price has increasingly reflected global economic currents:
- Financial Crisis Response: Episodes of banking instability or fiat currency devaluation often spark renewed interest in Bitcoin as a hedge.
- Regulatory Announcements: Clarity or crackdowns from entities like the SEC or the Chinese government trigger immediate chart reactions.
- Technological Milestones: The launch of bitcoin ETFs or major blockchain upgrades (e.g., Taproot) often coincide with notable chart inflections.
“For seasoned analysts, the bitcoin price graph isn’t just a speculative vehicle—it’s a barometer for technology adoption, investor psychology, and the shifting winds of global finance.”
— Jamie Douglas, Crypto Market Analyst
Live Bitcoin Charts: Tools and Best Practices
With a 24/7 global marketplace, real-time access to bitcoin price data is now a baseline expectation for many traders and observers.
Where to Find Reliable Bitcoin Price Graphs
A number of credible sources offer comprehensive, interactive bitcoin price graphs:
- Exchanges: Platforms like Coinbase, Binance, and Kraken provide integrated price charts with live data and built-in technical tools.
- Financial Data Sites: CoinMarketCap, CoinGecko, and TradingView are trusted resources for multi-exchange pricing, technical overlays, and community-generated analyses.
- Mobile Apps: Retail-focused apps (e.g., Blockfolio, Crypto.com) allow users to track price trends and news on the go.
Traders often use a combination of these platforms to cross-reference prices across exchanges, identify pricing anomalies, or monitor arbitrage opportunities.
Using Technical Analysis on Bitcoin Charts
While some investors set automated alerts based on simple price thresholds, more advanced users employ technical analysis—a discipline rooted in chart studies and pattern recognition.
Key tools include:
- Moving Averages (MA): Help smooth out volatility and highlight broader trends (e.g., 50-day and 200-day MAs).
- Relative Strength Index (RSI): Gauges whether bitcoin is overbought or oversold.
- Volume-Weighted Average Price (VWAP): Incorporates traded volume for a more accurate picture of price action.
Integrating these indicators with macro news flows can be challenging, but it offers a nuanced perspective on when risk may be rising or receding.
Case Study: Using the Bitcoin Price Graph for Decision-Making
Consider a scenario from late 2020. News of institutional purchases—such as MicroStrategy’s bold bitcoin treasury strategy—was accompanied by steady price moves above historical resistance levels. Savvy investors, noticing increasing volume and rising moving averages on the price graph, interpreted this not just as speculation, but as validation of Bitcoin’s role as an emerging store of value.
Shortly after, as retail interest reignited and global search trends for “bitcoin price graph” soared, the market witnessed new highs—a pattern that continues to play out as the narrative around bitcoin evolves.
Risks, Limitations, and the Human Factor
While bitcoin price graphs empower decision-making and storytelling, they also come with pitfalls:
- Volatility: Extreme swings, often triggered by whale trades or unanticipated regulatory shifts, can invalidate technical patterns.
- False Signals: Overreliance on chart patterns without broader context may encourage “confirmation bias.”
- Data Integrity: Not all data providers are equally accurate; prices can diverge slightly between exchanges due to liquidity variations.
Despite advanced analytics, no price graph can predict black swan events or capture the emotional undercurrents that drive both panic and euphoria. The wisest analysts blend chart study with critical thinking and robust risk management.
Conclusion: Seeing Beyond the Lines
The bitcoin price graph remains an indispensable compass for anyone navigating the fast-moving world of cryptocurrencies. From decoding historic surges to shaping day-trade strategies, its lines tell stories of disruption, innovation, and shifting global sentiment. Yet, behind every candlestick and trend line lies a deeper narrative—one shaped by new technologies, evolving regulations, and the collective psychology of millions of participants. Those who combine technical analysis with broad, informed perspective will be best positioned to decode what’s next on the bitcoin chart.
FAQs
What is a bitcoin price graph?
A bitcoin price graph is a visual chart that tracks the value of bitcoin over time, showing fluctuations and trends using various formats like line or candlestick charts.
Why do prices vary between bitcoin charts on different sites?
Bitcoin prices can differ due to variations in liquidity, trading volume, and local demand across exchanges. Most reliable graphs aggregate prices from multiple sources to offer a consensus value.
How do technical indicators help in analyzing bitcoin price trends?
Indicators like moving averages or RSI help highlight patterns, momentum, and potential reversal points, providing context for potential trade decisions or trend assessment.
Can the bitcoin price graph predict future prices?
While price graphs help identify patterns and historical trends, they cannot guarantee future performance since external events and market sentiment also play major roles.
Where can I find a reliable live bitcoin price graph?
Top platforms for live bitcoin price graphs include TradingView, CoinMarketCap, Binance, and Coinbase, all of which offer real-time updates and analytical tools.
Is it possible to make investment decisions based solely on the bitcoin price graph?
Relying solely on the price graph without considering broader market context, news, or fundamental analysis can be risky. A holistic approach is recommended for better judgment.