
The Bitcoin price index stands as a pivotal reference in the rapidly evolving cryptocurrency market. As digital assets become more mainstream, both individual investors and institutional players increasingly rely on accurate BTC price data to inform their decisions. Since the introduction of Bitcoin in 2009, its value has experienced extreme volatility—at times, swinging by double-digit percentages within days. This article explores how the Bitcoin price index functions, the factors driving Bitcoin’s price, methods for tracking real-time movement, and prevailing market trends shaping the future of the world’s leading cryptocurrency.
What Is the Bitcoin Price Index and Why Does It Matter?
A Bitcoin price index is an aggregated average price for BTC, calculated across various cryptocurrency exchanges. Unlike traditional stock indices, which rely on centralized trading venues, Bitcoin trades 24/7 across multiple platforms worldwide. The index works to provide a representative, real-time measure of Bitcoin’s value, smoothing out outliers due to liquidity discrepancies or isolated trading activity.
How the Index Is Calculated
- Aggregation: Data is sourced from numerous exchanges (such as Coinbase, Binance, Kraken, and Bitstamp).
- Weighting: Prices are often weighted based on trade volume and liquidity to ensure accuracy.
- Exclusions: Exchanges exhibiting signs of manipulation, outages, or illiquidity are generally excluded from reputable indices.
The end result is a transparent, relatively stable benchmark that institutional and retail investors can use for reference.
“Reliable indices are the backbone of trustworthy crypto markets. They help standardize valuation and foster investor confidence even amid volatility,” says Jenny Lee, Head of Research at a leading digital asset analytics firm.
Key Drivers Behind Bitcoin Price Movements
To make sense of BTC’s live value and its charts, it’s essential to understand the market forces at play. Several major factors influence day-to-day (and even minute-to-minute) Bitcoin price fluctuations.
1. Supply and Demand Dynamics
Bitcoin’s maximum supply is capped at 21 million coins, a feature coded into its protocol. As new coins become harder to “mine” (especially after key events known as “halvings”), the supply-side remains predictably scarce. Meanwhile, as mainstream attention grows, demand fluctuates based on public sentiment, institutional interest, and technological developments.
2. Macro-Economic Trends
Much like gold, Bitcoin is often dubbed “digital gold”—both are sometimes viewed as hedges against inflation, currency devaluation, or geopolitical instability. For example, during periods of global economic uncertainty, Bitcoin has attracted increased capital inflows, driving its price up.
3. Regulatory Developments and News
News around government regulation, adoption by large companies (such as Tesla, MicroStrategy, or payment providers like PayPal), and cryptocurrency bans or endorsements can lead to swift price swings. For instance, announcements of impending US Bitcoin ETF approvals have prompted noticeable rapid surges in BTC price indices.
4. Technological Upgrades and Network Events
Improvements to the Bitcoin protocol, or major technical milestones such as the implementation of the Lightning Network, can also influence investor enthusiasm and price trends.
Tools for Tracking Live BTC Value and Price Charts
Modern cryptocurrency markets are data-rich. Tracking real-time Bitcoin prices is possible through several platforms, each offering unique visualizations and tools.
Leading Index Providers
- CoinDesk Bitcoin Price Index (XBX): One of the oldest and most respected benchmarks, offering live charts and historical data.
- CoinMarketCap & CoinGecko: These sites aggregate prices, supply data, market capitalization, and visualization tools for in-depth analysis.
- Exchange APIs: Major exchanges like Binance or Coinbase provide public APIs, allowing developers and traders to build custom dashboards or automated strategies.
Interpreting Live Charts
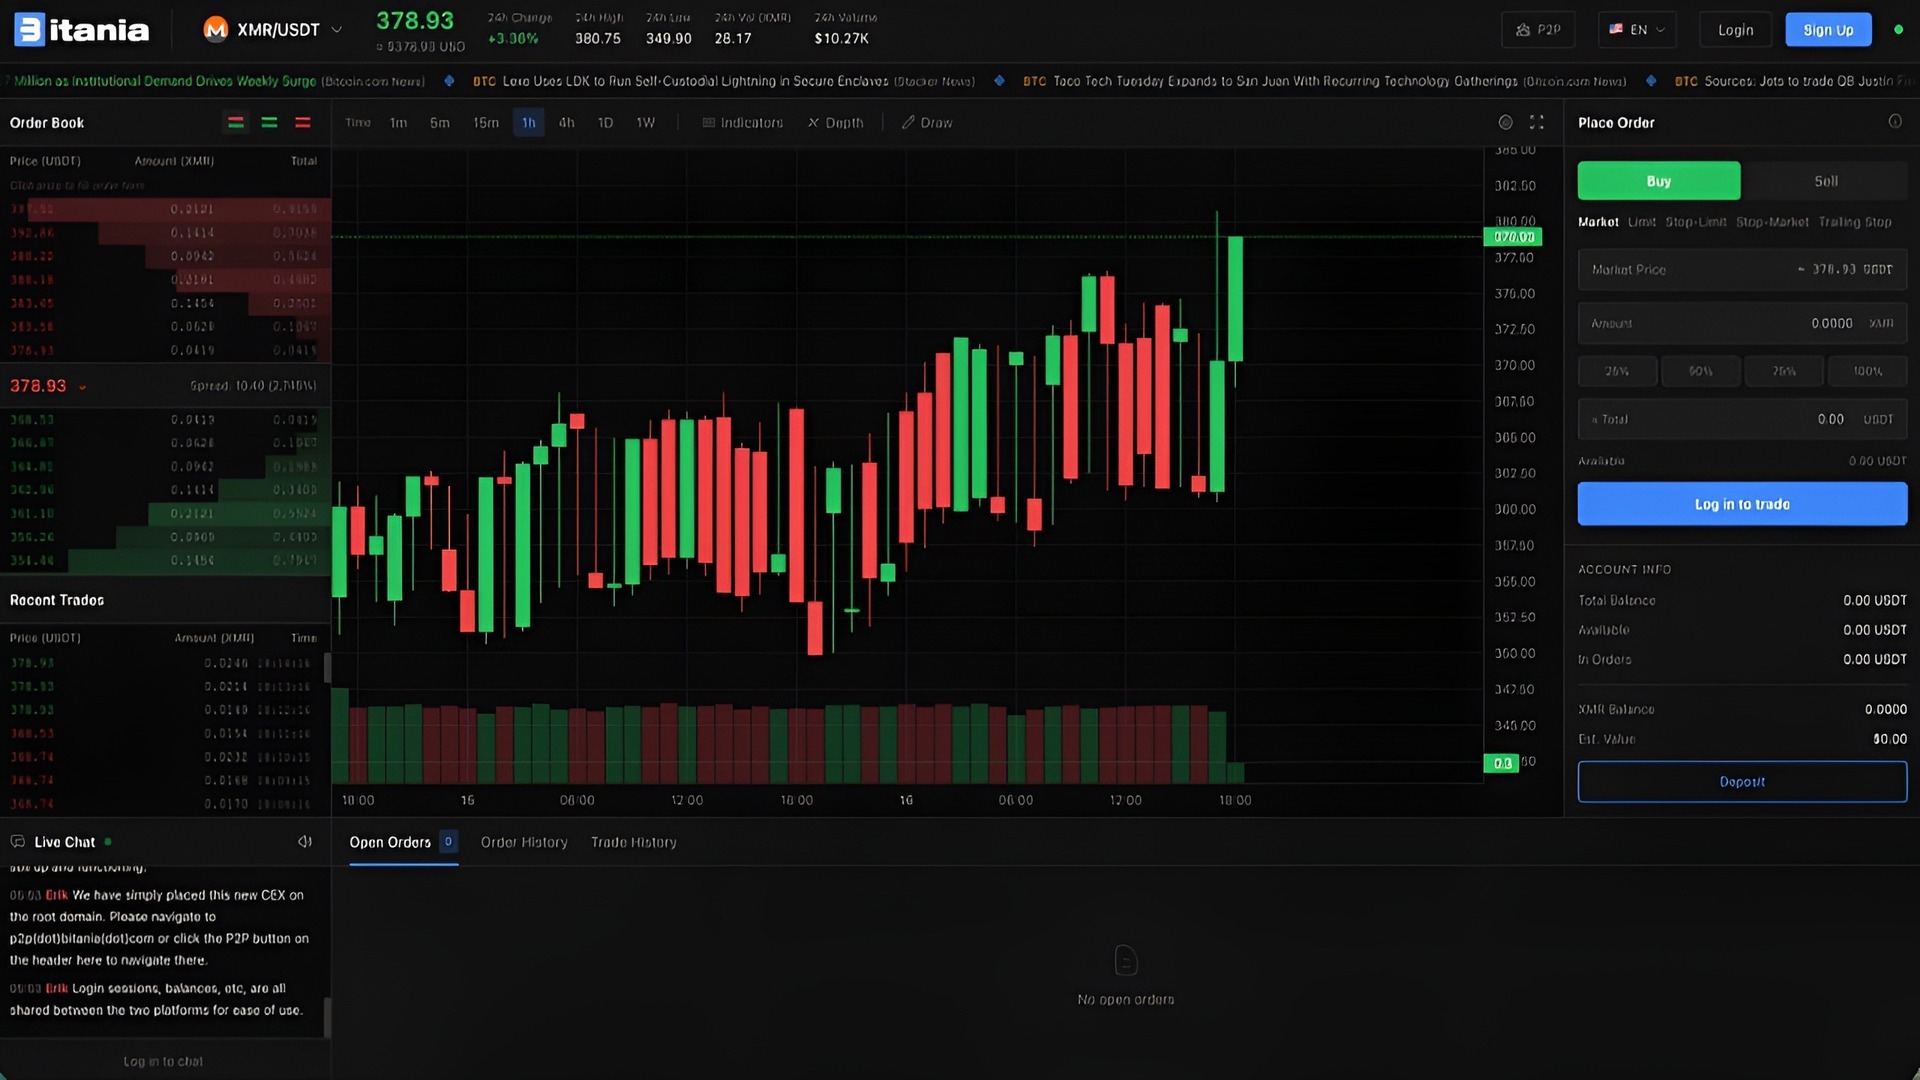
Charts range from simple line graphs to sophisticated candlestick and depth charts:
- Line Charts: Offer a straightforward visualization of Bitcoin’s price movement over time.
- Candlestick Charts: Used by traders for technical analysis, capturing open, close, high, and low values within fixed intervals (minutes, hours, days).
- Depth Charts: Illustrate buy and sell order volumes at various price levels, showing market liquidity and sentiment.
Market Trends: What Are Current and Future Directions?
Beyond fluctuations, patterns and macro-trends in the Bitcoin price index reveal much about the broader crypto ecosystem.
Institutional Adoption and ETFs
Recent years have seen a significant influx of institutional capital into Bitcoin, driven by the arrival of Bitcoin exchange-traded funds (ETFs) in US and international markets. These vehicles offer easier access for traditional portfolios and retirement accounts, spurring demand and price increases.
Increasing Correlation with Traditional Markets
While Bitcoin was once largely uncorrelated with traditional equities, recent data suggests a growing connection, especially during periods of significant market stress or central bank policy shifts. This trend is closely watched by risk managers and asset allocators.
Boom in Bitcoin Derivatives
Another notable trend is the expansion of futures, options, and perpetual swaps that reference the Bitcoin price index. Derivative markets provide tools for hedging and speculation, but they also introduce added leverage, amplifying market swings and liquidity risks.
Lightning Network and Layer 2 Growth
Technical advancements such as the growth of the Bitcoin Lightning Network (a “Layer 2” protocol) are supporting faster, low-cost microtransactions and making small payments practical—potentially expanding Bitcoin’s use case as both a store of value and a medium of exchange.
Navigating BTC Price Volatility: Risk and Opportunity
While the long-term trend for Bitcoin’s price has historically been upward, its volatility is among the highest in any asset class. Traders seek to profit from this, but volatility exposes new and experienced investors to significant risks.
Risk Management Approaches
- Diversification: Avoiding over-concentration in Bitcoin or crypto more broadly helps reduce portfolio risk.
- Position Sizing: Using clear rules for trade size helps protect from severe drawdowns during whipsaw moves.
- Staying Informed: Monitoring live price indices, news developments, and market sentiment is critical for active participants.
Real-World Example: 2021-2022 Price Swings
The period from the end of 2021 through early 2022 illustrated Bitcoin’s typical volatility. After a surge to all-time highs, BTC corrected sharply by over 50%, coinciding with changing Federal Reserve policies and broader risk-off sentiment in technology stocks.
Conclusion: Strategic Use of the Bitcoin Price Index
The Bitcoin price index is essential for anyone interacting with the cryptocurrency space, from individual enthusiasts and traders to institutions managing billions in crypto assets. By consolidating prices across exchanges, it offers clarity in a still-maturing market. However, as innovation, regulation, and macroeconomic forces converge, it remains vital to approach Bitcoin investments with robust strategies and up-to-date information.
Staying educated—in real time—on BTC value, understanding what drives chart movements, and recognizing emerging trends provides the foundation for sound decision making in one of the world’s most dynamic financial markets.
FAQs
What is the Bitcoin price index and how is it calculated?
The Bitcoin price index is a weighted average of BTC prices from multiple major exchanges, adjusting for volume and liquidity. It ensures a more accurate benchmark than relying on any single trading venue.
Why does the Bitcoin price differ between exchanges?
Price differences occur due to variations in supply, demand, trading volume, and liquidity on each exchange. Arbitrage by traders usually keeps discrepancies relatively small.
How can I track live Bitcoin prices and charts?
Platforms like CoinDesk, CoinMarketCap, Binance, and Coinbase offer real-time BTC data, interactive charts, and historical trends to help track live price movements easily.
What events most commonly impact BTC price volatility?
BTC price volatility is often influenced by major news events, market sentiment shifts, macroeconomic data, and regulatory changes, as well as substantial moves by large asset holders.
Is the Bitcoin price index the best tool for timing trades?
While the index provides a reliable real-time reference, timing trades also requires understanding market context, technical indicators, and risk management principles.
How do regulatory changes affect the Bitcoin price index?
Announcements related to crypto regulations or futures/ETFs can cause quick spikes or drops in the BTC index due to shifts in investor sentiment and market participation.